-
Home

- Articles & Povs
Articles & PoVs
Firm facts, collective experience

Most organizations have invested in AI. Very few have invested in the conditions AI needs to actually work. The gap between the two is where ROI disappears.

European telecom operators are investing heavily in 5G, fibre, AI, and network modernisation. Yet despite this sustained investment, financial performance across the sector remains under pressure.

Focusing on integration architecture, orchestration, and structured legacy modernization enables organizations to move beyond system replacement and achieve meaningful change.

The traditional marketplace model is no longer enough for sustainable telco monetisation. While many telcos have invested in building a digital platform and expanding their partner ecosystem, these efforts often fall short of delivering long-term growth.

Across the telecom industry, OSS/BSS legacy modernization has become a priority. Operators are investing heavily in new platforms, digital capabilities, and automation to improve agility and customer experience.

Self-healing systems. Real-time optimisation. Intent-driven operations. Networks that can configure, manage, and optimise themselves with minimal human intervention.

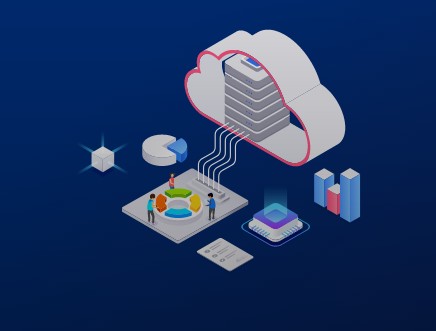
Over the past decade, BFSI companies have invested in large, centralized Global Capability Centres (GCCs) as a lever for efficiency and digital transformation.

Logistics growth across the GCC is no longer constrained by infrastructure or trade ambition. Ports, free zones, and national trade platforms in the UAE and Saudi Arabia have laid strong digital foundations.

Enterprises are shifting from traditional outsourcing models to establishing Global Capability Centers (GCCs) that manage complex, strategic functions in-house.

Large enterprises and regulated industries are not constrained by access to suppliers. Banks, insurers, telecom operators, utilities, and government entities already operate broad partner ecosystems.

Omnichannel retail has matured beyond channel presence. In 2026, competitive advantage comes from how well systems are integrated, not how many platforms are deployed.

The term online marketplace is widely used but poorly understood in enterprise settings. In many organizations, it is still associated with ecommerce storefronts or listing portals.

Across global operators, telco transformation integration has become the invisible constraint holding back business outcomes.

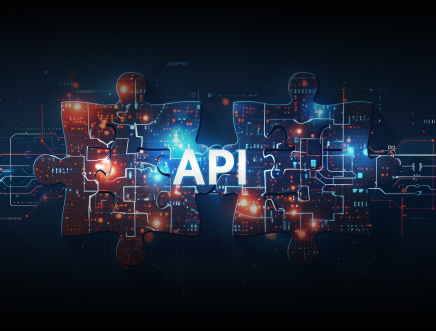
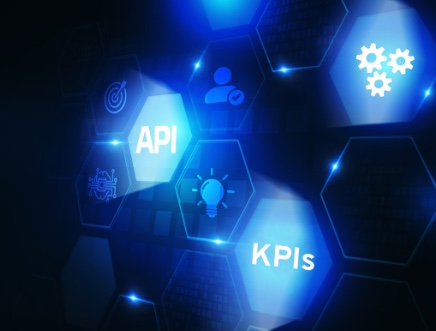
APIs have become the execution backbone for digital products, partner ecosystems, and AI-driven services. As enterprises scale APIs across cloud, hybrid, and partner environments, the choice of an API management platform increasingly determines governance effectiveness, security posture, delivery speed, and long-term operating cost.
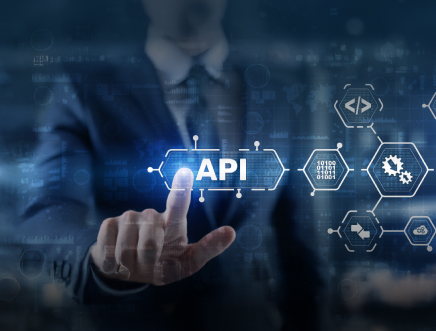
API sprawl, inconsistent governance, and security gaps have become material risks for digital transformation. As APIs multiply across teams, clouds, and partners, weak control at the API layer quickly translates into operational fragility and compliance exposure.

Look beyond the signal bars, streaming apps and seamless video calls, and you'll find an industry undergoing a profound internal transformation.

APIs now sit at the heart of enterprise digital strategy, powering open banking, digital government services, telecom partner ecosystems, omnichannel retail, and AI-driven automation.

Across the UK, EU, and the Middle East, governments are under pressure to deliver fast, secure, and citizen-centric digital services.

Modern integration is no longer about a central bus. It is about APIs, domain ownership, and resilient microservice architecture that supports continuous change.

Japanese insurance company Dai-ichi Life Group, aiming to transform into a capital-light, tech-driven business and expand globally, sets up a Global Capability Center (GCC) in India, but takes cautious steps because of cultural and linguistic barriers.

We hired Prompt Engineers, organized "generative AI bootcamps," and filled our Slack channels with tips on how to coax a better response out of an LLM.

For more than a decade, operators have been told the same story: “APIs are the future; telcos must stop being just a pipe.” And yet, despite dozens of whitepapers, standards of bodies, and pilot projects, the API opportunity still feels stuck in PowerPoint mode for most CSPs.

With how we see the world growing, Global Capability Centers are no longer just about cutting costs, for many enterprises, they've become the fastest, most reliable way to build and scale AI capability at pace.

Organizations across the UK and Europe are facing mounting pressure: evolving regulations, rising compliance demands, rapid digital transformation, and the need to future-proof infrastructure for AI and data-intensive workloads. While “lift-and-shift” offers an easy path to cloud, it often fails to deliver long-term benefits and may leave enterprises with legacy problems locked in.

The shift toward domain-led Micro GCCs is reshaping how global enterprises scale digital, AI, and operational excellence. For CEOs, CFOs, COOs, and CDOs across the UK and Europe, these smaller, specialist capability centers offer something large GCCs cannot: speed, governance clarity, and measurable value within a quarter.
AI governance is no longer optional. For organizations operating in BFSI, healthcare, telco, government, and fintech, it has become mission critical.

Several enterprises are entering a new phase of global scaling – a phase where agility, compliance, and rapid digital acceleration matter more than size.

The conversation around cloud in Europe has grown up. In major markets like the Nordics and the UK, the question is no longer whether to migrate, but how to operate seamlessly across a diverse digital estate. But as 'Cloud First' matures into 'Cloud Smart,' a critical gap is emerging. Without a cohesive enterprise integration strategy, multi-cloud environments don't just add scale; they add friction.

Telcos are sitting on one of the most valuable yet underexploited assets in the digital economy: data. As mobile data volumes surge and 5G, IoT, and real-time services reshape demand, the economics of connectivity alone are no longer sufficient.
For CIOs and CTOs, APIs have quietly become one of the most valuable, and most fragile, assets in the enterprise. They power digital channels, connect partners, expose data to AI systems, and increasingly act as products in their own right.
APIs sit at the centre of enterprise digital strategy. They power digital government services, open banking platforms, telecom partner ecosystems, omnichannel retail, and healthcare interoperability across the UK, Europe, and the Middle East.
The digital landscape is undergoing a fundamental shift. We are moving from the era of API 1.0 where the goal was simply to make APIs available to API 2.0, where the focus is on using APIs to orchestrate complex, multi-tiered, connected ecosystems.

The promise or potential of AI continues to dominate conversations in Global Capability Centers (GCC). However, the next logical stage–converting that potential into action and sustainable impact–has proven to be elusive.

Market benchmarks highlight the gap. SaaS platforms and cloud marketplaces generate 30-50% of revenue from ecosystem partners. CSPs average around 15%, despite managing far larger infrastructure footprints and customer relationships.

In 2025-2026, integration architecture is the fastest way to turn cloud, data, and AI investments into real business outcomes, especially for UK and European enterprises navigating multi-cloud complexity, SaaS sprawl, and legacy constraints.

UK and European enterprises are operating in a new reality: digital ecosystems are larger, more interconnected, and far less forgiving when something breaks.

Healthcare leaders across the UK and Europe are under intense pressure to deliver better outcomes with fewer resources. Waiting lists remain stubborn, clinical teams are stretched, and costs are rising across diagnostics, staffing, and operations. In that environment, AI in healthcare is becoming a practical lever to improve performance across clinical and administrative workflows.

Most enterprise transformations fail for one reason: systems don’t move together. Digital integration is the missing layer that turns cloud, data, AI, and customer experience into a single operating model.

Global Capability Centers (GCCs) have evolved a lot over the years. What started as a way for companies in the EU and UK to cut costs through offshore talent has now become a key part of driving real growth and fresh ideas. In today's quick-changing business environment, just having a GCC isn't enough. It needs to be scaled up fast, adapt to new challenges, and play a big role in pushing digital changes forward.

Wholesale broadband has entered a phase of scale. Fiber footprints are extensive, capacity is no longer scarce, and coverage maps look reassuringly complete.

For years, integration has been treated as the unglamorous plumbing behind digital transformation - necessary, expensive, and rarely discussed outside IT. But as enterprises accelerate automation, move workloads to the cloud, and embed AI across the business, something fundamental is becoming clear: integration is no longer a backstage function.

Enterprises are running faster but managing slower. Digital innovation accelerates, yet IT foundations remain tangled in manual workflows, silos, and reactive governance.

Most enterprises are already deep into modernization. The question that lies ahead is no longer whether to modernize, but where actually does modernization deliver measurable business value and where changes create unnecessary risk.

Global enterprises are undergoing a fundamental shift in how they build and scale capability. For years, the traditional Global Capability Center (GCC)

Over the last decade, Global Capability Centers (GCCs) have evolved from back-office processing hubs to engines of digital transformation.

As enterprise transformation accelerates, large Global Capability Centers (GCCs) are hitting structural limits. Built for scale and cost optimization, they struggle to deliver the agility, specialization, and speed required for AI-driven, cloud-native, and experience-led digital programs.

Walk into any boardroom today and you will hear the same three phrases within the first five minutes: “AI is moving too fast.” “We need to experiment more.” “And why does everything take so long?”

The way companies build their global teams is changing fast. Across the UK and Europe, business leaders are facing a perfect storm: tighter regulations, pressure to make AI actually work, talent that's harder to find, and technology systems that are creaking under the weight of years of quick fixes.

In the rapidly evolving landscape of artificial intelligence, Agentic AI is emerging as a transformative force, empowering systems to act autonomously toward specific goals with minimal human intervention. Unlike traditional AI models that follow rigid scripts, Agentic AI often referred to as autonomous AI agents, mimics human-like decision-making to navigate complex, dynamic environments.

4Sight addresses this challenge by embedding foresight directly into business operations, moving predictive intelligence out of specialist silos and into the fabric of ecosystems.

AI-driven data platforms unify workloads, enhance privacy, automate pipelines, and prioritize ethical, responsible innovation for scalable, efficient, and future-ready operations.

GCCs drive digital transformation through AI and automation, boosting competitiveness and future-readiness by leading enterprise-wide tech innovation.

In a world where data defines business success, organizations are finding new ways to turn information into insights for efficient operations and business breakthroughs.

The era of treating Global Capability Centers (GCCs) as discretionary cost-arbitrage vehicles is fading.

API sprawl is a business risk, not just a tech problem: Redundant, siloed APIs create inefficiencies and blind spots without centralized visibility.AI outperforms traditional governance: It catches duplicates, anomalies, and patterns missed by static rules and manual oversight.

McKinsey estimates that generative AI will contribute $2.6 trillion to $4.4 trillion annually across industries, with software development being a primary beneficiary. Organizations with a mature AI-driven pipeline are already delivering secure, scalable software efficiently.

Despite increasing technology investments to enable smarter decision-making, enterprises often fall short due to misaligned objectives, a lack of ownership, and a focus on broader connectivity rather than business impact.

By 2028, global data volumes are expected to soar to 394 zettabytes, yet most enterprises struggle to turn this information into actionable insights.

As digital marketplaces evolve, relying solely on a single revenue stream is no longer sufficient for sustained growth. While transaction fees once provided a predictable income based on volume, the current marketplace landscape demands a more multifaceted approach.

In today’s fast-evolving digital economy, Marketplace-as-a-Service (MaaS) is rapidly emerging as a transformative force in B2B commerce.

In today’s era of digital transformation, marketplaces have evolved from traditional storefronts into intelligent, dynamic ecosystems.

Telecom companies worldwide have made significant capital investments to navigate rapid technological advancements while maintaining agility.

Over the past decade, businesses have transitioned from isolated operations with fragmented data to highly interconnected ecosystems powered by real-time intelligence, driving efficiency and innovation across industries.

Organizations are turning to Application Programming Interfaces (APIs) to extend their business capabilities. However, the true potential of APIs lies beyond basic API management – it is realized through API marketplaces.

The Middle East is advancing digital transformation with initiatives like Saudi Arabia’s Vision 2030 and UAE’s Centennial 2071 plan. The G2B2C model, supported by AI, enhances public services, citizen engagement, and economic growth. AI-powered platforms like DubaiNow and UAE API Marketplace drive innovation and collaboration between governments, businesses, and citizens.

The telecom industry is undergoing one of the most significant shifts in its history. As operators accelerate 5G rollouts, navigate exponential data growth, and expand into new digital business models, traditional operational structures are proving inadequate.

In an era where businesses are driven by efficiency, innovation, and global expansion, Global Capability Centers (GCCs) have emerged as a critical enabler of enterprise transformation.

As LEAP 2025 approaches, the premier technology event in Saudi Arabia, we are excited to showcase SMART Souq – our AI-powered marketplace-in-a-box solution, along with our comprehensive portfolio of enterprise-grade IT services in cloud, integration, and data

Evolution is part of the API lifecycle. With a fast-evolving digital landscape, businesses rely heavily on APIs to enable seamless communication between applications, services and data. Every enterprise needs to be driven towards migrating to a better and more efficient version of APIs.

In a world where data defines business success, organizations are finding new ways to turn information into insights for efficient operations and business breakthroughs. It has given rise to greater reliance on global capability centers (GCCs)—dedicated entities set up by companies to streamline and centralize key business functions—as dynamic data hubs.

In today’s rapidly evolving technological landscape, 5G networks and edge computing present significant opportunities for businesses to enhance their operations.

The platform-based business model is the most successful yet at bringing unlimited numbers of parties together who want to interact and transact.

As enterprises navigate multi-cloud and hybrid infrastructures, the surge in data silos and complex data environments has created challenges that impact agility, scalability, and operational costs.

The rapid growth of enterprise data presents a significant challenge - gaining competitive advantage from this data while navigating the complexities of silos and fragmented infrastructures.

An average enterprise has a multitude of APIs to manage, and for some it is an ever-increasing number. With the number of APIs increasing, there comes the need for central management and governance of APIs.

Artificial intelligence (AI) and application programming interfaces (API) are an integral part of our lives, from digital assistance, fraud protection to social media bots and fraud detection.

For mid-sized companies to excel in today's fast-evolving business landscape, embracing Application Programming Interfaces (API) as strategic assets can be a smart approach to drive competitive advantage, speed up time-to-market, and boost ecosystem engagement.

Future-ready enterprises are enhancing their data assets by partnering with Torry Harris, driving innovation and growth. Their comprehensive Data Management Services include consulting, data transformation, architecture, design, and automation solutions.

As organizations gear up to capture their share of an estimated $17.7 trillion of value that data and analytics can unlock, they are driving a cultural shift towards informed decision-making through data democratization.

Generative Artificial Intelligence (Gen AI), with its ability to autonomously produce novel insights from data it is fed, holds immense business potential

In today's competitive landscape, organizations must embrace data-driven practices. Many struggle to embed data into their culture. Data democratization empowers everyone, not just experts, to leverage data effectively at scale.

An exponential increase in data generation has contributed to the evolution of data management from transactional systems to enterprise data warehouses and data lakes.

Advances in Artificial Intelligence (AI) continue to reshape the security landscape, enabling organizations to minimize their exposure to vulnerabilities. While AI has improved the efficiency of detection and response on a large scale

APIs have gone beyond technical development opportunities and are now bringing strategic value to businesses. They are opening new revenue lines. Whether it is the Printicular app from MEA labs that leveraged Walgreens’ photo printing and pharmacies through an API or APIs provided by Salesforce.com, Expedia, Zapier, and Google, revenues have skyrocketed.

Generative AI (GenAI) is revolutionizing customer experience (CX) across various industry sectors by enabling deeper personalization, streamlining customer and employee services, and optimizing operations.

The role of Global Capability Centers (GCCs) has become crucial in the operational strategies of multinational companies, providing a combination of cost efficiency, skilled talent, and innovation. In 2024, the emergence of artificial intelligence (AI), cloud technology, and digital ecosystems is reshaping the landscape for GCCs.

In an era of increased globalization, businesses are actively seeking opportunities beyond their local markets to access a diverse global talent pool.

Global Capability Centers (GCCs) have played a crucial role in driving operational efficiencies and fostering innovation for large enterprises at a global scale.

In today's dynamic business landscape, companies must consistently strive for innovation to remain competitive. That's where Global Capability Centers (GCCs) come in, transforming traditional operations and driving strategic growth through cost optimization and cutting-edge solutions.

In today's ever-evolving digital landscape, businesses need to stay ahead of the competition while maintaining operational efficiency and cost-effectiveness.

This article endeavors to delve into the Digital BOT model and examine how it can serve as a game-changer for businesses aiming to transform their operations.

Effective data integration enables organizations to consolidate disparate data sources and create single sources of truth, improving decision-making and timely responses to market changes.

Data integration enables organizations to dismantle data silos and derive a holistic view of data from disparate sources including traditional databases, cloud-based applications, social media, and IoT devices.

Conversational AI- a sophisticated data-driven technology enabling human-like dialogue across digital platforms–is empowering businesses from diverse industries to deliver quick, friendly, scalable, and personalized customer experiences round the clock.

GenAI creates new content, including images, and texts, by learning from training datasets. Its ability to simulate complex behaviors, generate novel and personalized content, adapt in real-time, and remain robust even in the face of data scarcity sets it apart from traditional AI and Machine Learning (ML) models.

Data analytics and customer research, personalization, multichannel presence, and intelligent outsourcing can make a world of a difference in the way you are perceived by your customers. When done well, this results in generating customer loyalty and translates to revenues.

Transformations aren’t easy, they don’t happen overnight and without governance and reporting measures, there is a strong possibility of failure to change and a loss of credibility for the teams involved.

AI is revolutionizing healthcare by enhancing diagnostic accuracy, personalizing treatments, streamlining medical delivery, and facilitating industry advancements in predictive analytics, significantly improving patient outcomes.

Transformation is commonly likened to a metamorphosis where, in early stages, the caterpillar starts small and inexperienced. Focused on growth and survival, the caterpillar goes on to adapt, transform and emerges as a butterfly - an irreversible phenomenon.

At Torry Harris, we are committed to creating future-fit organizations in healthcare through interoperability. Our Interoperability Kit for Digital Healthcare Data Exchange streamlines the adoption of FHIR-compliant APIs and optimizes the value derived from data exchange.

Healthcare regulations in the US, aimed at improving quality care, patient safety, and data privacy, have increased the cost, administrative, and audit burden on providers. Compliance is an increasingly complex subject, sometimes with regulations differing even between states, that existing systems and processes cannot tackle seamlessly and efficiently.

Cloud applications and services are bringing the benefits of the cloud to the healthcare industry including scalability to serve variable workloads, accelerating the speed of innovation, access to the latest security and infrastructure technology and big data diagnostics and analytics.

The digitalization of healthcare has raised concerns about data privacy and security. Read this blog to understand how to address these concerns and enable seamless data access.

In the ever-evolving landscape of contemporary business, the transformative power of digital ecosystems and marketplaces has emerged as a defining force.
In 2008, a significant outage in its data center prevented Netflix from sending DVDs to its customers for three days which prompted the company to rethink its IT architecture.
Generative Artificial Intelligence (Gen AI) has taken businesses to the edge of a new frontier that promises unprecedented levels of productivity, innovation, and new revenue streams.

Organizations today are confronted with challenges arising from the growing number of applications and managing the volume of data being generated across cloud and on-premise environments.

Today, as business data increasingly proliferates a multitude of systems, app-integration teams are finding it increasingly difficult to keep pace. While a platform-based approach takes the pain out of integrating and scaling applications, the volume, velocity, and veracity of data are adding to integration complexities.

Site reliability engineering is a process that relies on software tools to automate and streamline IT infrastructure tasks like incident response, system management, change management, and application monitoring.

Many IT leaders are investing in cloud migration as part of their digital transformation strategy, but the industry’s success record has been patchy. According to a 2021 report by McKinsey, poorly orchestrated cloud migrations could cost enterprises up to US$100 billion over the next three years.

A UK-based telco migrated to the cloud to take advantage of cost efficiencies and scalability through cloud adoption. But contrary to expectations, the costs kept mounting over time and strained the telcos operating budgets.

With data pouring in from multiple sources, in different formats and across multiple environments, traditional ETL methods for data integration can no longer cope with the growing volume, variety and velocity of data. Data virtualization (DV) can help by acting as a bridge between disparate data sources, unifying them to deliver a single source of truth for consumers.

Modernizing existing legacy applications is the first step in any organization's digital transformation roadmap. Other than preparing the groundwork for an agile, scalable and reliable IT infrastructure...

The cloud-native era of application development allows for a much higher rate of iteration than previously possible with legacy application architecture. Monolithic application development lifecycles are ill-suited to the demands of hyper-growth minded...

Data is continuously evolving, and with it, we’re seeing rapid changes in streaming architecture, data warehousing, platform clustering and more. Exponential growth in the volume and velocity of available data has made centralized organization and management extremely difficult...

Cloud migration is a notoriously complex process that presents enormous challenges with respect to data security, governance, and a host of other considerations. A recent study showed how 75% of enterprises struggle to secure infrastructure configuration, access, and APIs.

Read this cloud computing blog on the top cloud computing trends of 2023 that discusses serverless computing, edge computing, blockchain and cloud collaboration, cloud gaming, AI/ML and containerized applications.

Cloud computing has been a historical leap forward, especially when it comes to managing IT resources. On-demand access to IT infrastructure like computing power, storage, servers, and databases has redefined the meaning of agility and scalability in today’s businesses.
Migrating applications and data to the cloud and deploying cloud-native technologies promises many business and operational benefits – from reduced risk, cost, and downtime to greater operational and business flexibility, bringing advantages such as faster time to market and the ability to react faster to market changes.
As digital marketplaces mature, they evolve, and we are now well and truly into the era of digital marketplace 2.0, where, as we explored here, differentiation is the name of the game. In a highly competitive world, a digital or physical item or service is much the same, regardless of where the customer buys it.

AIOps is a category of tools designed to bring the benefits of AI, most typically machine learning, to data generated by telemetry. The aim is to enable teams to evaluate and act on data faster, reduce manual tasks and human errors, and predict and so prevent problems.

Digital Marketplace products play a central role in providing a customer-facing storefront, where your offerings can be bundled with your partner’s offerings and sold online.
"Open APIs had a big role to play in standardizing access for interoperability across group companies and surfacing local capabilities seamlessly in a global marketplace solution." Joffey Chandy Business Unit Head – Telecom and Public Sector

Traditional business models are unable to longer drive growth in the new normal. Research conducted by Accenture Global found that organizations that doubled down on tech investments before the pandemic are now growing 5x faster than their non-tech counterparts

Microservices are central to a cloud native architecture because they structure applications as a collection of services that are easy to maintain and test. Microservices are loosely coupled, meaning that constituent parts can be updated and swapped, and each can be deployed independently.
When asked about what a telecoms network operator would look like in the future and what capabilities are most important, the CTO of one of the world’s largest telecom operator groups1 said he and his organization need to be a systems integrator.

The federal website funded by U.S. Centers for Medicare & Medicaid Services notes, “the lack of seamless data exchange in healthcare has historically detracted from patient care, leading to poor health outcomes, and higher costs”.

Cloud has immense potential for enterprises to do lots of things better. Sometimes though, we forget that migration to the cloud is a huge and rare opportunity to do things differently as well as better – and smart integration is a big part of achieving that.

Enterprises today have an enormous volume of data spread across numerous on-premise, private cloud and public cloud locations. Cloud data integration is critical for consolidating all that data into a single, unified hybrid cloud environment, enabling enterprises to leverage that data to achieve impactful business outcomes.

Data integration consulting can help enterprises understand the data they have at their disposal and use it to solve emerging business challenges.

Digital companies are laser-focused on customer experience. Creating data-driven, actionable insights is one of their biggest weapons in the war to win and keep customers, and this comes from being able to combine disparate data sets – data integration.
Enterprises operating a number of different B2B and B2C APIs across subsidiaries and operational companies (OpCos), need to have a comprehensive, effective governance strategy in place to ensure all their APIs are standardized and consistent across the entire ecosystem.
Digitalization is a top priority for businesses in the digital economy. Far too often, however, organizations move headlong into their digital transformation efforts without stopping to properly prepare their systems and processes for the transition.
Emulating that model and becoming an extended enterprise is the motivation for digital transformations, that is bringing customers and partners together to buy and sell products, solutions and services.
The introduction of APIs is an exercise of integration. This cohesive umbrella, the structure to secure compliance of published norms across diverse users and often business units, is referred to as “API governance”.

Your legacy assets, enriched over time, are important and valuable – they are what makes your company unique. They contain years of evolved business rules and transactions.

Governance and governance structure are often seen as the domain of specialists, and something of a back-office function. Digital transformation is a fundamental switch from being product and service-oriented to becoming customer centric.

The typical smart home has devices by multiple brands. This brings several service areas up for competition. Vendors may have individual apps to control their respective devices. However, an app that offers universal smart home controls would set trends. This is one of the obvious gaps asking to be filled by market savvy enterprises.

Telcos and financial institutions can empower SMEs by bundling their core services and functionality in an “as-a-service” model, along with digital enablement tools.

The term "legacy" was coined in the 1970s to describe computer systems. This refers to any hardware or software widely accepted in the past but has become outdated and/or needs better support and ability to extend and expose functionality with newer solutions.

CI and CD are some of the most common abbreviations with hundreds of different meanings. Notwithstanding, CI/CD in software development refers to specific DevOps practices that are becoming very popular in the systems development life cycle (SDLC).

Intelligent Automation is boosted by the growing demand to digitize and automate business processes at a time when the Covid-19 pandemic requires rapid workplace transformation.

Intelligent Automation is a combination of Artificial Intelligence (AI), Robotic Process Automation (RPA), and process orchestration. It offers a comprehensive, end-to-end solution to undertake digital transformation. It is not a stand-alone process, instead, it comprises of various interconnected technologies, organizing work across human-robot teams.

Remote working may have been enforced due to the prevailing situation for businesses around the world. However, after experiencing it first-hand, many may end up making it a logical choice even post COVID-19 crisis.

The success and smoothness of operations of the past few months has planted seeds of interesting, game-changing ideas which we are in discussions about, with our strategic teams. Compliances like ISO are for a physical premise, but these controls can be implemented successfully as cloud solutions for our remote workforce.

The COVID pandemic has brought about a few new ways to think about Business Continuity Planning (BCP). The traditional model for BCP was more or less relegated to the backbench because of the current situation facing the world.

Modernizing applications by adopting microservices requires a new set of tools for efficiency and speed. My blog aims to guide you by reviewing tools that help with microservices.

Microservices Governance is an approach or method that sets up best principles, policies, and standards that enable a successful transition to a microservices landscape.

In order to resolve the challenges of outdated infrastructure, you need a cost-effective solution that enables you to securely and quickly access and process essential business data from any device.

A mature integration strategy, a strong governance framework and robust implementation of such an integration framework largely determine the success of your digital transformation initiative. In this blog, we discuss common integration challenges faced by large enterprises and present a wider scope for integration that transcends organizational boundaries.

An API gateway provides a single, secure point of entry to access all your APIs. It offers a simple, consistent interface for all clients and partners to access your APIs and plays a key role in full lifecycle API management.

Designing, creating, integrating and managing APIs for a business is a critical prerequisite for participating in a digital ecosystem. And to leverage APIs effectively, a business must put a clear, realistic API strategy in place, start with small wins and then build on them.

In order to grab a part of the action and participate in the race to form digital ecosystems, every enterprise worth its salt is involved in a transformation of some sort. The market is now filled with digital transformation solutions to cater to this need.

Open-Banking is gaining popularity with consumers and banks through the relatively new phenomenon of marketplace-banking. Marketplace-banking is attractive to consumers because it provides a wealth of new services via their bank’s app.

An API store is a one-stop-shop designed for API consumers and partners to explore the catalog of API solutions made available through your company. The store provides a convenient self-service access to these APIs.

As enterprises expand their API-driven digital initiatives, a customer-centric mind-set with a focus on the “experience” element helps to attract and sustain traffic to developer portals, which are the face of an organization’s API offerings. A shift from just building a developer portal to building an end-to-end developer experience becomes important.

With increasingly new channels to market, nimble startups and “fintech” innovations, it is imperative that incumbent banks and financial institutions stay relevant through forging their own digital ecosystems and adopting API monetization strategies.

With increasing customer expectations driven by Big Techs, consumers want similar experiences from their telecom providers. To this end, CSPs are reinventing themselves through digital transformation initiatives for providing better customer experience

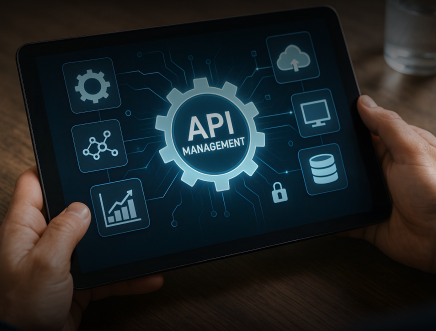
A robust API management strategy is a must to effectively monetize your APIs. Managing your APIs is not just about the security aspect but about how well they are designed, what implementation standards they’re built on, how they are deployed, their discoverability and monitorability.

A key outcome of Digital transformation is in the creation of new business models and meaningful partner and customer ecosystems that allow a business to evolve with the times. Instead of trying to compete by bettering your existing products and services, digital transformation is about disrupting the norm and offering new services and products that transform your business.

Here, in this post, we explain the role of open banking APIs in shaping the revenue streams of the financial services industry.

A well-managed API marketplace is a competitive advantage for enterprises to market their APIs. In this post, you will find three areas that will need your attention when building an API-driven digital ecosystem.

API management as the name suggests, helps manage the entire lifecycle of APIs – from the initial planning, design and documentation of APIs to deploying them and tracking their usage till their retirement. The API strategy of an organization sets the context for API management.

Digital Transformation is a prerequisite for all organizations in today’s dynamic ever-changing ecosystem of technology. This new transformation is changing business models and processes; making them increasingly customer-centric.

API business strategy is a component of your overall business strategy, where APIs are positioned as monetizable business offerings. A strong API strategy enables creation of Digital Platform business models that exponentially increase the value of transactions by creating a network effect.

APIs and integration as a means to connect internal and external ecosystems are key ingredients to success for digital transformation initiatives. It becomes imperative that they are done right - all the way from strategy to execution.

Competition to secure retail consumers has resulted in price cutting, as differences in service features is marginal.

Torry Harris offers a variety of services and technology products in the API space that may be used to quickly expose and connect assets and data of the providers chosen by the communities that you form.

For value creation, you will have to think about finding your core value provision, your core capabilities, mapping through IT systems built on APIs and making them open APIs.

There is a process to build a useful digital ecosystem that can also include connected devices that enables the collection, connection, crafting and combination, needed to make the most of existing investments.

With today’s focus on the role of digital ecosystems and the Internet of Everything, integration, API management and big data are all key tools.

If customers know that their data is secure, well managed and they have a stake in its use, they may be more inclined to engage with the organisation.

The telecommunication industry may seem like a giant making easy money, too big to be bothered by their modern rivals. However, when you look closely, you will realise that telcos globally are constantly battling to stay competitive. The challenges telcos face have evolved through the years, and the battle for survival is only becoming harder.

Digitization or digital transformation is the most important element of any business evolution. When we use the term “digital” we refer to the term sigital economy using APIs as a means.